Use the figure below to answer the following question.
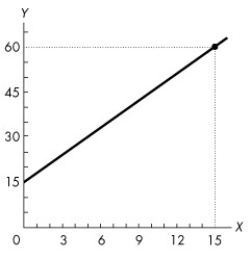
Figure 1A.5.5
-Refer to Figure 1A.5.5. The graph shows the relationship between two variables, x and y. Which of the following equations describes this relationship?
A) y = 3x + 15
B) y = -3x + 15
C) y = -3x2 + 15
D) y = 15x + 3
E) x = 15y + 3
Correct Answer:
Verified
Q189: Use the figure below to answer the
Q192: Use the figure below to answer the
Q201: Use the figure below to answer the
Q202: Use the table below to answer the
Q202: Use the figure below to answer the
Q203: The equation of a line is y
Q203: Which of the following equations describes a
Q207: The equation of a line is y
Q209: If the equation of a straight line
Q211: If the equation of a straight line
Unlock this Answer For Free Now!
View this answer and more for free by performing one of the following actions

Scan the QR code to install the App and get 2 free unlocks

Unlock quizzes for free by uploading documents