Use the figure below to answer the following questions.
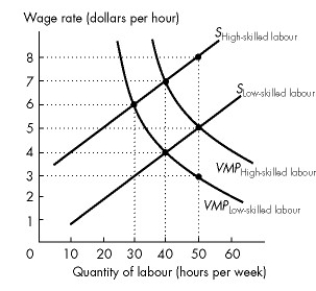
Figure 19.3.5
-Refer to Figure 19.3.5. This figure shows the labour supply curves and the value of marginal product curves for high-skilled and low-skilled workers. The equilibrium wage rate for low-skilled workers is
A) $3 an hour.
B) $7 an hour.
C) $6 an hour.
D) $5 an hour.
E) $4 an hour.
Correct Answer:
Verified
Q62: Use the figure below to answer the
Q63: Which one of the following is not
Q64: Complete the following sentence.Passing on wealth from
Q65: Use the figure below to answer the
Q65: A generation that is wealthy and leaves
Q66: Use the figure below to answer the
Q68: Which of the following three statements is
Q69: Use the figure below to answer the
Q72: Use the figure below to answer the
Q74: Other things remaining the same,if education costs
Unlock this Answer For Free Now!
View this answer and more for free by performing one of the following actions

Scan the QR code to install the App and get 2 free unlocks

Unlock quizzes for free by uploading documents