Table 2.1.1
The following table gives points on the production possibilities frontier for goods X and Y.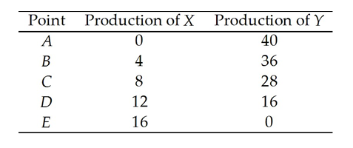
-From the data in Table 2.1.1 we can infer that
A) the economy illustrated has a comparative advantage in the production of Y.
B) the economy illustrated has a comparative advantage in the production of X.
C) the opportunity cost of producing an additional unit of Y increases as the production of Y increases.
D) the opportunity cost of producing an additional unit of Y decreases as the production of Y increases.
E) none of the above.
Correct Answer:
Verified
Q27: Use the figure below to answer the
Q37: If additional units of any good could
Q38: Use the figure below to answer the
Q39: A medical clinic has 10 workers. Each
Q40: If opportunity costs are increasing, then the
Q42: Use the figure below to answer the
Q45: Use the figure below to answer the
Q46: Use the table below to answer the
Q56: The economy illustrated by the data in
Q59: Use the table below to answer the
Unlock this Answer For Free Now!
View this answer and more for free by performing one of the following actions

Scan the QR code to install the App and get 2 free unlocks

Unlock quizzes for free by uploading documents