Table 2.1.1
The following table gives points on the production possibilities frontier for goods X and Y.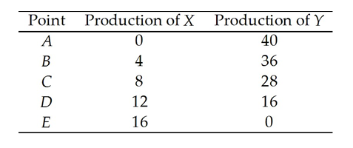
-The diagram of the production possibilities frontier corresponding to the data in Table 2.1.1 would be
A) negatively sloped and linear.
B) negatively sloped and bowed inward.
C) negatively sloped and bowed outward.
D) positively sloped for X and negatively sloped for Y.
E) a horizontal line.
Correct Answer:
Verified
Q42: Use the figure below to answer the
Q45: Use the table below to answer the
Q46: Use the table below to answer the
Q54: Table 2.1.1
The following table gives points on
Q56: Use the table below to answer the
Q57: As we move down the bowed-out production
Q58: Jane produces only corn and cloth.If her
Q62: Use the figure below to answer the
Q63: Use the figure below to answer the
Q64: The marginal benefit curve from a good
A)shows
Unlock this Answer For Free Now!
View this answer and more for free by performing one of the following actions

Scan the QR code to install the App and get 2 free unlocks

Unlock quizzes for free by uploading documents