Use the figure below to answer the following questions.
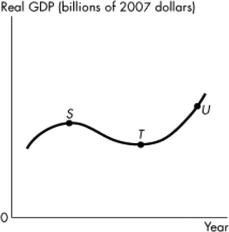
Figure 20.3.1
-Refer to Figure 20.3.1. In the figure, the distance between points T and U represents
A) an expansion.
B) a trough.
C) a peak.
D) a recession.
E) a business cycle.
Correct Answer:
Verified
Q101: Use the figure below to answer the
Q102: In comparing the United States and China
Q103: Why is the Human Development Index thought
Q104: Use the figure below to answer the
Q105: The maximum level of real GDP that
Q107: The four parts of the business cycle
Q108: Which of the following statements by politicians
Q109: When we use PPP we can make
Q110: Which of the following is not a
Q111: The existence of which one of the
Unlock this Answer For Free Now!
View this answer and more for free by performing one of the following actions

Scan the QR code to install the App and get 2 free unlocks

Unlock quizzes for free by uploading documents