Use the figure below to answer the following questions.
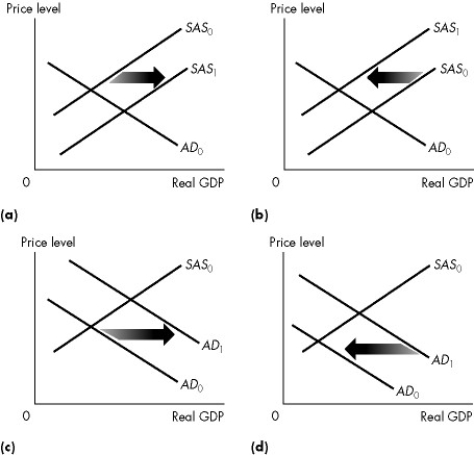
Figure 26.2.1
-Refer to Figure 26.2.1. Which graph illustrates what happens when government expenditure decreases?
A) (a) only
B) (b) only
C) (c) only
D) (d) only
E) Both (a) and (d)
Correct Answer:
Verified
Q36: Which one of the following variables is
Q37: If a change in wealth is induced
Q38: Long-run aggregate supply will increase for all
Q39: Which of the following situations illustrates how
Q40: If the price level rises, then the
Q42: A recessionary gap is the amount by
Q43: Which one of the following is a
Q44: Full-employment equilibrium occurs when
A)aggregate demand equals short-run
Q45: Which one of the following newspaper quotations
Q46: Foreign exchange dealers expect the Canadian dollar
Unlock this Answer For Free Now!
View this answer and more for free by performing one of the following actions

Scan the QR code to install the App and get 2 free unlocks

Unlock quizzes for free by uploading documents