Use the figure below to answer the following question.
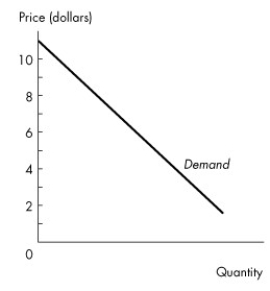
Figure 4.1.1
-Figure 4.1.1 illustrates a linear demand curve. Comparing the price elasticity in the $2 to $3 price range with the elasticity in the $8 to $9 range, we can conclude
A) that demand is more elastic in the $8 to $9 price range.
B) that demand is more elastic in the $2 to $3 price range.
C) that the price elasticity of demand is the same in both price ranges.
D) nothing without numerical information about quantities.
E) that the price elasticity of demand is zero in both price ranges because the demand curve is a straight-line demand curve.
Correct Answer:
Verified
Q23: Use the figure below to answer the
Q24: Suppose that the price elasticity of demand
Q25: Which one of the following will yield
Q26: Suppose the quantity of root beer demanded
Q27: Demand will be more inelastic the
A)higher the
Q28: The quantity of apples demanded decreases by
Q30: Use the table below to answer the
Q31: Suppose the government of Nova Scotia wants
Q32: A perfectly vertical demand curve indicates that
Q33: Use the table below to answer the
Unlock this Answer For Free Now!
View this answer and more for free by performing one of the following actions

Scan the QR code to install the App and get 2 free unlocks

Unlock quizzes for free by uploading documents