Use the figure below to answer the following questions. 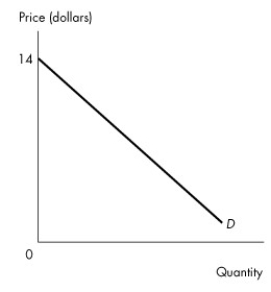 Figure 4.1.2
-Figure 4.1.2 illustrates a linear demand curve.If the price falls from $4 to $2,
A) total revenue increases.
B) total revenue decreases.
C) total revenue remains unchanged.
D) the quantity demanded increases by more than 10 percent.
E) the percentage change in quantity demanded is more than the percentage change in price.
Correct Answer:
Verified
Q29: Suppose the quantity of root beer demanded
Q30: Demand will be more elastic the
A)lower the
Q31: Use the table below to answer the
Q32: Use the figure below to answer the
Q33: For which one of the following will
Q35: Demand will be more inelastic the
A)lower the
Q36: Suppose the Lethbridge Computer Company decides to
Q37: Suppose the government of Nova Scotia wants
Q38: Use the table below to answer the
Q39: At a price of $15,Jack's quantity demanded
Unlock this Answer For Free Now!
View this answer and more for free by performing one of the following actions

Scan the QR code to install the App and get 2 free unlocks

Unlock quizzes for free by uploading documents