Use the figure below to answer the following questions.
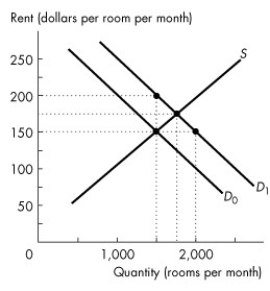
Figure 6.1.1
-Refer to Figure 6.1.1. If the demand for rental housing increases and the demand curve shifts rightward from D₀ to D₁, and the market is unregulated, the number of rooms rented is
A) 1,500, and the rent rises to $200 a month.
B) 2,000, and the rent is at its initial level.
C) 1,750, and the rent rises to $175 a month.
D) 2,000, and the rent rises to $200 a month.
E) 1,750, and the rent rises to $200 a month.
Correct Answer:
Verified
Q4: When a price ceiling is set below
Q5: A price ceiling set below the equilibrium
Q9: The time spent looking for someone with
Q14: An illegal market in which the equilibrium
Q18: Use the figure below to answer the
Q22: An effective rent ceiling
A)increases producer surplus.
B)results in
Q25: When rent is not permitted to allocate
Q26: Discrimination allocates scarce housing
A)to those who are
Q27: According to the fair result view of
Q33: According to the fair rules view of
Unlock this Answer For Free Now!
View this answer and more for free by performing one of the following actions

Scan the QR code to install the App and get 2 free unlocks

Unlock quizzes for free by uploading documents