Use the figure below to answer the following questions. 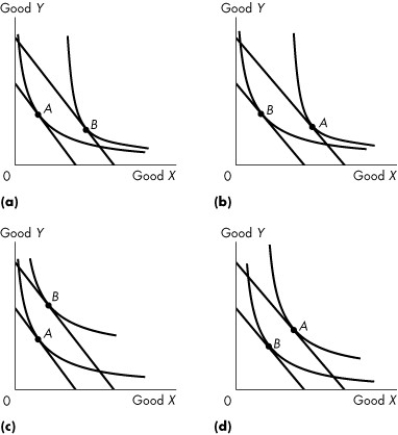 Figure 9.3.4
Original equilibrium at A,new equilibrium at B
-Refer to Figure 9.3.4.Which graphs show the case where good Y is a normal good?
A) (a) and (b)
B) (c) and (d)
C) (a) and (c)
D) (b) and (d)
E) none of the graphs
Correct Answer:
Verified
Q110: When Jim is at his best affordable
Q111: Use the figure below to answer the
Q112: When price rises,the substitution effect
A)always increases consumption.
B)increases
Q113: Albert is consuming at a point where
Q114: Use the figure below to answer the
Q115: For a normal good,the income effect
A)is negative
Q116: Use the information below to answer the
Q117: If the price of an inferior good
Q119: Use the information below to answer the
Q120: Use the information below to answer the
Unlock this Answer For Free Now!
View this answer and more for free by performing one of the following actions

Scan the QR code to install the App and get 2 free unlocks

Unlock quizzes for free by uploading documents