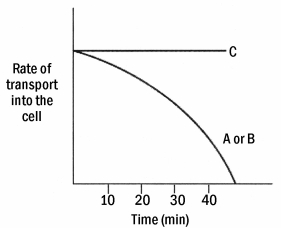
The graph below shows the rate of transport for each substance when the cells are placed in 0.10 mM solutions of A,B,and C.Based on these data and coupled with the data observed above,substance C is transported via ________.
Correct Answer:
Verified
Q19: You are wanting to modify plant cells.With
Q20: What is the ∆G′ for the inward
Q21: Cystic fibrosis is the result of a
Q22: While working with a novel cell line,you
Q23: The graph above shows the initial rate
Q25: Assuming no change in either the internal
Q26: What would be the net ∆G′ for
Q27: Based on the same graph,substances B and
Q28: Which of the following is not a
Q29: Which type of ATPase is associated with
Unlock this Answer For Free Now!
View this answer and more for free by performing one of the following actions

Scan the QR code to install the App and get 2 free unlocks

Unlock quizzes for free by uploading documents