Use the figure below to answer the following questions.
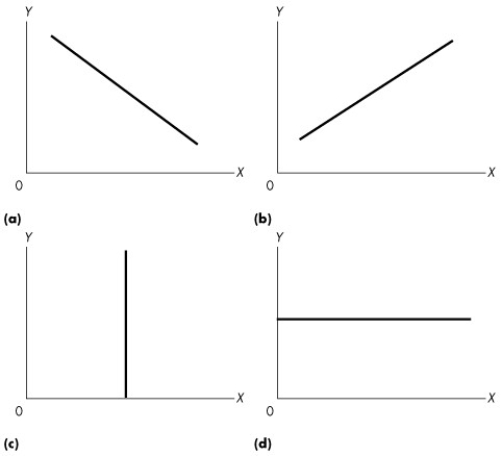
-Figure 1A.2.3 12) Refer to Figure 1A.2.3. If you were told that economic theory predicts that higher levels of the rate of interest (x) lead to lower levels of sales of houses (y) , which graph would you pick to represent this economic relationship?
A) (a)
B) (b)
C) (c)
D) (d)
E) (a) or (d)
Correct Answer:
Verified
Q122: Use the figure below to answer the
Q126: Use the figure below to answer the
Q127: Use the figure below to answer the
Q131: Use the figure below to answer the
Q132: Use the figure below to answer the
Q134: Use the figure below to answer the
Q137: The relationship between two variables that move
Q138: Use the figure below to answer the
Q139: Two variables are positively related if
A)increases in
Q140: Use the figure below to answer the
Unlock this Answer For Free Now!
View this answer and more for free by performing one of the following actions

Scan the QR code to install the App and get 2 free unlocks

Unlock quizzes for free by uploading documents