Use the figure below to answer the following questions.
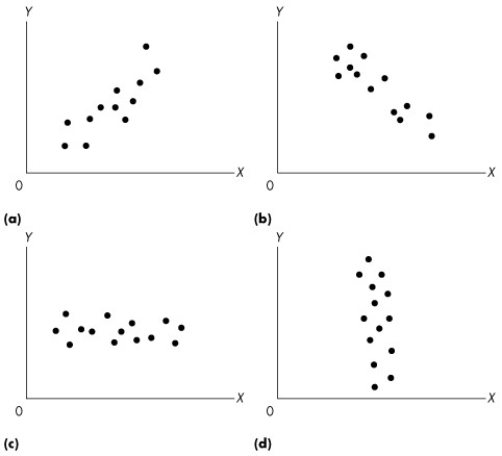
Figure 1A.1.5
-Refer to Figure 1A.1.5. Which graph or graphs indicates a negative relationship between x and y?
A) (a)
B) (b)
C) (c)
D) (d)
E) (b) and (d)
Correct Answer:
Verified
Q83: Which of the following is a positive
Q87: An economic model is
A)tested by examining the
Q88: Which of the following is an example
Q91: In choosing among alternative models,economists generally have
Q93: An economic model is tested by
A)examining the
Q99: "The rich face higher income tax rates
Q108: Use the information below to answer the
Q108: "The rich face higher income tax rates
Q109: Which of the following statements are positive?
Q115: A good economic model
A)does not include more
Unlock this Answer For Free Now!
View this answer and more for free by performing one of the following actions

Scan the QR code to install the App and get 2 free unlocks

Unlock quizzes for free by uploading documents