Use the figure below to answer the following questions.
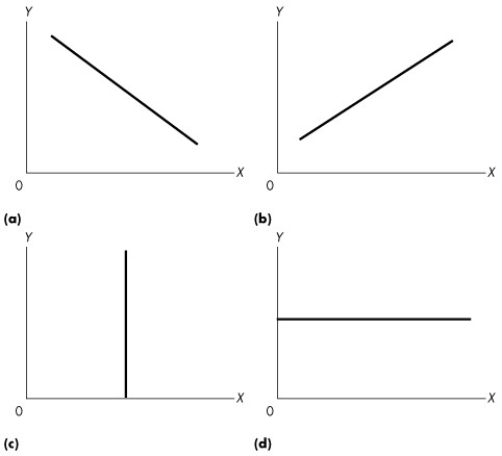
Figure 1A.2.3
-Refer to Figure 1A.2.3. Suppose our theory predicted that for low levels of quantity produced (x) a firm's profits (y) were low, for medium levels of output their profits were high, and for high levels of output their profits were low again. Which one of the graphs would represent this relationship?
A) (a)
B) (b)
C) (c)
D) (d)
E) none of the graphs
Correct Answer:
Verified
Q82: Select the best statement about economic models.
A)An
Q95: A normative statement is a statement regarding
A)what
Q117: To disentangle cause and effect, economists use
Q118: Which of the following is a normative
Q121: Use the figure below to answer the
Q123: The relationship between two variables that are
Q125: Use the figure below to answer the
Q126: Use the figure below to answer the
Q127: Use the figure below to answer the
Q139: Two variables are positively related if
A)increases in
Unlock this Answer For Free Now!
View this answer and more for free by performing one of the following actions

Scan the QR code to install the App and get 2 free unlocks

Unlock quizzes for free by uploading documents