Use the figure below to answer the following questions.
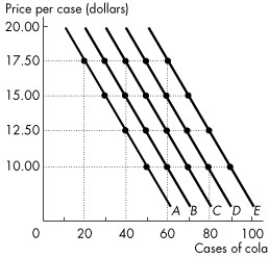
Figure 1A.4.5
-Consider the following information on cola sales by number of cases for a typical university residence floor: 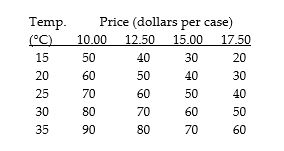
70 60
Refer to Figure 1A.4.5.Which line shows the relationship of cola sales and its price when the temperature is 30°C?
A) A
B) B
C) C
D) D
E) E
Correct Answer:
Verified
Q171: Use the table below to answer the
Q183: Use the figure below to answer the
Q194: Use the figure below to answer the
Q198: Given the data in Table 1A.4.2,suppose family
Q198: Use the figure below to answer the
Q199: Given the data in Table 1A.4.2,holding price
Q200: Use the figure below to answer the
Q200: Use the figure below to answer the
Q201: Use the figure below to answer the
Q209: If the equation of a straight line
Unlock this Answer For Free Now!
View this answer and more for free by performing one of the following actions

Scan the QR code to install the App and get 2 free unlocks

Unlock quizzes for free by uploading documents