Use the figure below to answer the following questions.
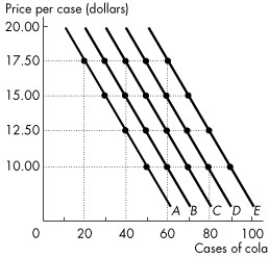
Figure 1A.4.5
-Consider the following information on cola sales by number of cases for a typical university residence floor: 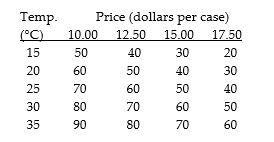
Refer to Figure 1A.4.5.Which one of the following represents what happens when the temperature rises from 20°C to 25°C?
A) The curve shifts from A to B.
B) The curve shifts from C to B.
C) The curve shifts from B to C.
D) The curve shifts along line B.
E) The curve shifts along line C.
Correct Answer:
Verified
Q169: Use the table below to answer the
Q179: Consider the data in Table 1A.4.1.Suppose z
Q180: To graph a relationship among three variables
Q181: Given the data in Table 1A.4.2,holding income
Q183: Use the figure below to answer the
Q185: To graph a relationship among more than
Q186: Use the figure below to answer the
Q186: Use the table below to answer the
Q191: Use the figure below to answer the
Q197: The Latin term ceteris paribus means
A)"Innocent until
Unlock this Answer For Free Now!
View this answer and more for free by performing one of the following actions

Scan the QR code to install the App and get 2 free unlocks

Unlock quizzes for free by uploading documents