Table 2.1.1
The following table gives points on the production possibilities frontier for goods X and Y.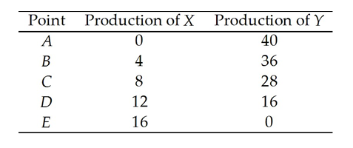
-Refer to Table 2.1.1. As we increase the production of X,
A) the amount of Y that is given up for each additional unit of X decreases.
B) the output of Y increases.
C) the opportunity cost of each additional unit of X increases.
D) unemployment increases.
E) the amount of X increases at an increasing rate.
Correct Answer:
Verified
Q44: Use the figure below to answer the
Q46: Use the table below to answer the
Q48: The slope of the production possibilities frontier
Q48: Use the table below to answer the
Q49: Use the table below to answer the
Q50: Table 2.1.1
The following table gives points on
Q52: Use the figure below to answer the
Q54: Table 2.1.1
The following table gives points on
Q56: Use the table below to answer the
Q57: As we move down the bowed-out production
Unlock this Answer For Free Now!
View this answer and more for free by performing one of the following actions

Scan the QR code to install the App and get 2 free unlocks

Unlock quizzes for free by uploading documents