Use the figure below to answer the following question. 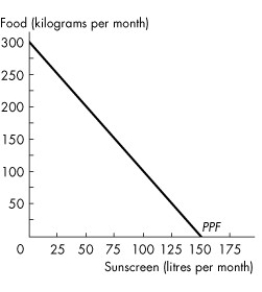 Figure 2.1.5
-The graph in Figure 2.1.5 shows Sunland's PPF for food and sunscreen.Sunland faces ________ opportunity cost of food and ________ opportunity of sunscreen.
A) an increasing;a decreasing
B) a constant;a constant
C) a decreasing;an increasing
D) an increasing;an increasing
E) a decreasing;a decreasing
Correct Answer:
Verified
Q47: Use the table below to answer the
Q48: Use the table below to answer the
Q49: When producing at a point of production
Q50: From the data in Table 2.1.1,the production
Q51: From the data in Table 2.1.1,the production
Q53: The slope of the production possibilities frontier
Q54: Use the figure below to answer the
Q55: Refer to Table 2.1.1.As the production of
Q56: The economy illustrated by the data in
Q57: The production possibilities frontier is
A)upward sloping and
Unlock this Answer For Free Now!
View this answer and more for free by performing one of the following actions

Scan the QR code to install the App and get 2 free unlocks

Unlock quizzes for free by uploading documents