Use the figure below to answer the following question.
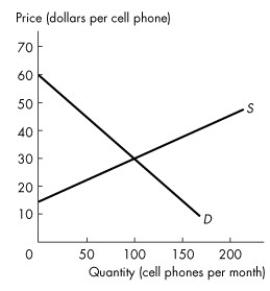
Figure 5.3.4
-Refer to Figure 5.3.4. The graph shows the market for cell phones. When production is efficient, total surplus is ________ and the cost of producing the cell phones sold is ________.
A) $2,250; $2,250
B) $2,250; $3,000
C) $1,500; $750
D) $750; $1,500
E) $1,500; $2,250
Correct Answer:
Verified
Q62: Use the figure below to answer the
Q70: The price of pizza increases.Everything else remaining
Q77: As the quantity of hot dogs demanded
Q82: When a deadweight loss occurs in a
Q83: Overproduction of a good means that
A)deadweight loss
Q88: An external cost
A)is a marginal benefit.
B)results in
Q91: Which of the following lead to an
Q100: A monopoly leads to
A)overproduction.
B)underproduction.
C)efficient production.
D)maximization of consumer
Q110: Use the figure below to answer the
Q113: It is efficient to produce an additional
Unlock this Answer For Free Now!
View this answer and more for free by performing one of the following actions

Scan the QR code to install the App and get 2 free unlocks

Unlock quizzes for free by uploading documents