Use the figure below to answer the following questions.
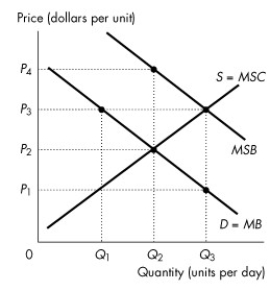
Figure 16.3.1
-Refer to Figure 16.3.1. The figure shows the marginal private benefit curve, the marginal social benefit curve, and the market supply curve. If production is left to the private market, then
A) the quantity produced is less than the efficient quantity.
B) the quantity produced is greater than the efficient quantity.
C) price is greater than marginal social benefit quantity.
D) the marginal cost curve is horizontal.
E) the quantity produced is zero.
Correct Answer:
Verified
Q56: Pollution occurs when lumber is produced. If
Q57: Use the figure below to answer the
Q58: If negative externalities exist, then in a
Q59: When the marginal social cost of the
Q60: When the production of a good has
Q62: Use the figure below to answer the
Q63: Use the figure below to answer the
Q66: Use the figure below to answer the
Q77: Producing paper creates pollution.There is no externality
Q78: A production technology that reduces or prevents
Unlock this Answer For Free Now!
View this answer and more for free by performing one of the following actions

Scan the QR code to install the App and get 2 free unlocks

Unlock quizzes for free by uploading documents