Use the figure below to answer the following questions.
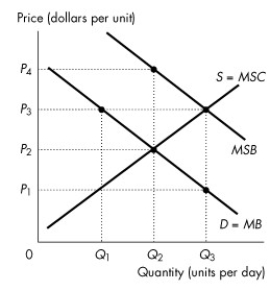
Figure 16.3.1
-Refer to Figure 16.3.1. The figure shows the marginal private benefit curve, the marginal social benefit curve, and the market supply curve. If a subsidy is granted that generates an efficient quantity, then the quantity produced is
A) zero.
B) Q₁.
C) Q₂.
D) Q₃.
E) greater than Q₃.
Correct Answer:
Verified
Q53: When Good A is produced,pollution is also
Q68: Choose the statement that is incorrect.
A)Firms that
Q71: Use the figure below to answer the
Q72: The government department charged with monitoring and
Q73: Choose the statement that is incorrect.
A)Between 2008
Q74: The marginal private benefit curve (MB)is a
Q76: Use the information below to answer the
Q77: Environment Canada was created in
A)1971.
B)1961.
C)1981.
D)1991.
E)2001.
Q79: A chemical factory and a fishing club
Q79: Use the table below to answer the
Unlock this Answer For Free Now!
View this answer and more for free by performing one of the following actions

Scan the QR code to install the App and get 2 free unlocks

Unlock quizzes for free by uploading documents