Use the figure below to answer the following questions.
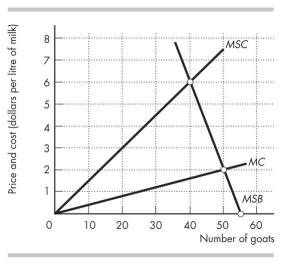
Figure 17.3.2
-Figure 17.3.2 shows the marginal private cost curve, marginal social cost curve, and marginal social benefit curve for raising goats on a common pasture. The equilibrium in an unregulated market is
A) 0 goats.
B) 40 goats.
C) 50 goats.
D) 55 goats.
E) 35 goats.
Correct Answer:
Verified
Q82: Setting a production quota does not always
Q85: All of the following statements are true
Q86: For a common resource,the marginal private cost
Q88: Use the figure below to answer the
Q89: Use the figure below to answer the
Q90: Use the figure below to answer the
Q91: Use the figure below to answer the
Q93: When a production quota is used to
Q96: Use the figure below to answer the
Q97: Use the figure below to answer the
Unlock this Answer For Free Now!
View this answer and more for free by performing one of the following actions

Scan the QR code to install the App and get 2 free unlocks

Unlock quizzes for free by uploading documents