Figure 1-1
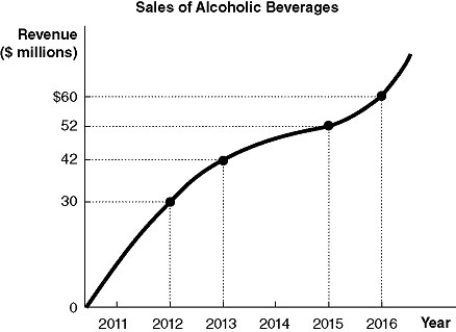
-Refer to Figure 1-1.Using the information in the figure above, calculate the percentage change in sales of alcoholic beverages between 2012 and 2016.
A) 30%
B) 50%
C) 66.7%
D) 100%
Correct Answer:
Verified
Q208: In the market for factors of production,
Q214: What is a firm? What other terms
Q222: Table 1-4 Q223: You explain to your roommate Surya, who Q224: The prevalence of Alzheimer's dementia is very Q226: Figure 1-1 Q228: Figure 1-3 Q232: If the price of gasoline was $3.25 Q238: Figure 1-2 Q239: If a straight line passes through the Unlock this Answer For Free Now! View this answer and more for free by performing one of the following actions Scan the QR code to install the App and get 2 free unlocks Unlock quizzes for free by uploading documents
![]()
![]()
![]()
![]()

