Multiple Choice
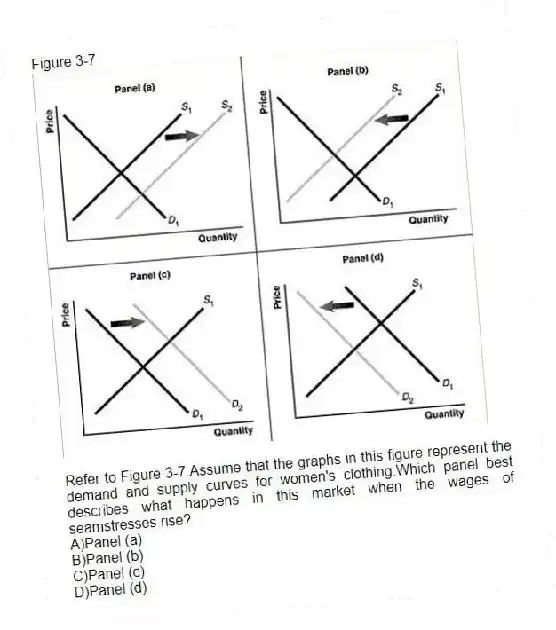
Figure 3-7

-Refer to Figure 3-7.Assume that the graphs in this figure represent the demand and supply curves for women's clothing.Which panel best describes what happens in this market when the wages of seamstresses rise?
A) Panel (a)
B) Panel (b)
C) Panel (c)
D) Panel (d)
Correct Answer:
Verified
Related Questions

