Multiple Choice
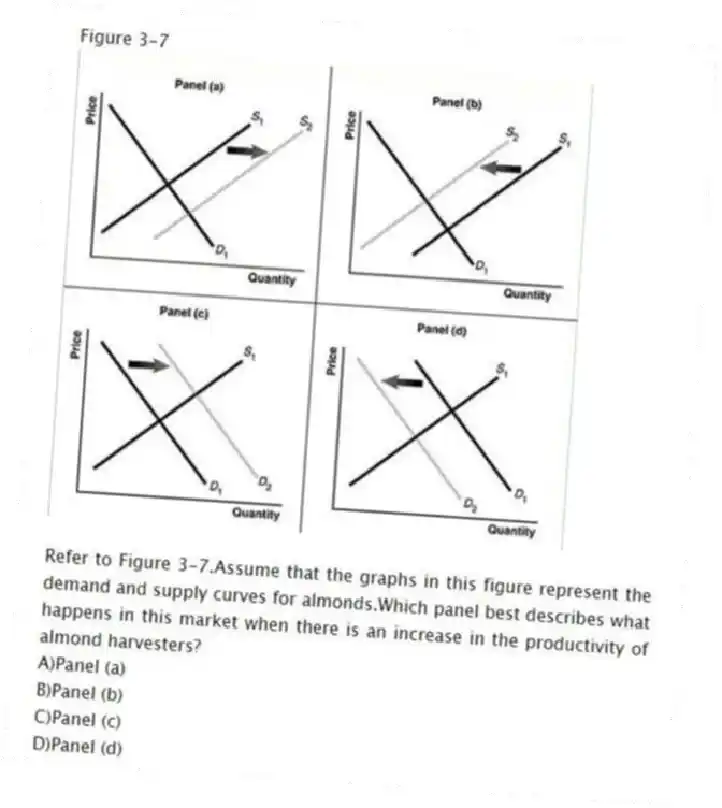
Figure 3-7

-Refer to Figure 3-7.Assume that the graphs in this figure represent the demand and supply curves for almonds.Which panel best describes what happens in this market when there is an increase in the productivity of almond harvesters?
A) Panel (a)
B) Panel (b)
C) Panel (c)
D) Panel (d)
Correct Answer:
Verified
Related Questions
Q176: Assume that potatoes are an inferior good.Which
Q177: Olive oil producers want to sell more
Q178: Let D = demand, S = supply,
Q179: In recent years, the cost of producing
Q180: An article in the Wall Street Journal
Unlock this Answer For Free Now!
View this answer and more for free by performing one of the following actions

Scan the QR code to install the App and get 2 free unlocks

Unlock quizzes for free by uploading documents