Figure 3-7

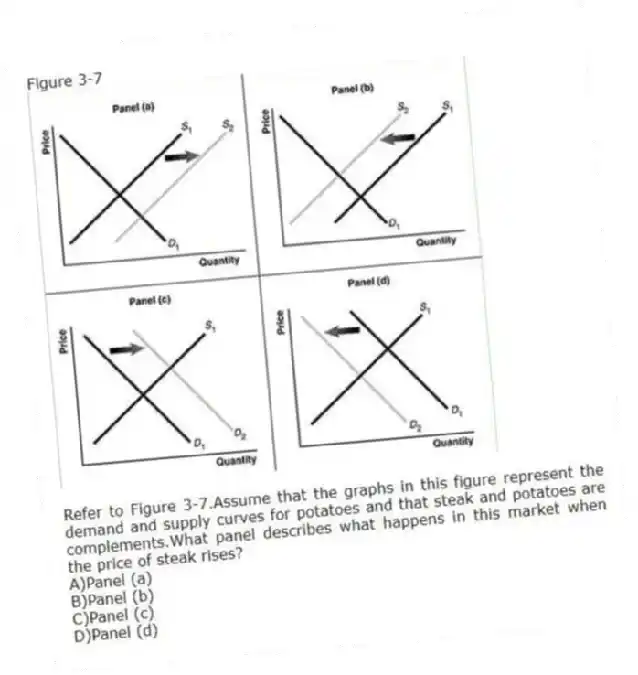
-Refer to Figure 3-7.Assume that the graphs in this figure represent the demand and supply curves for potatoes and that steak and potatoes are complements.What panel describes what happens in this market when the price of steak rises?
A) Panel (a)
B) Panel (b)
C) Panel (c)
D) Panel (d)
Correct Answer:
Verified
Q177: Olive oil producers want to sell more
Q178: Let D = demand, S = supply,
Q179: In recent years, the cost of producing
Q180: An article in the Wall Street Journal
Q181: Figure 3-7 Q183: Figure 3-7 Q184: Assume that both the demand curve and Q185: Assume that the demand curve for MP3 Q186: An increase in input costs in the Q187: Figure 3-8 Unlock this Answer For Free Now! View this answer and more for free by performing one of the following actions Scan the QR code to install the App and get 2 free unlocks Unlock quizzes for free by uploading documents
![]()
![]()
![]()

