Figure 3-8
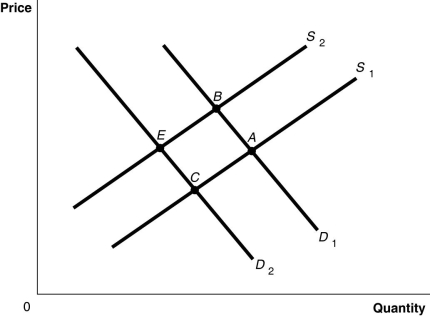
-Refer to Figure 3-8.The graph in this figure illustrates an initial competitive equilibrium in the market for apples at the intersection of D₁ and S₂ (point B) . Which of the following changes would cause the equilibrium to change to point C?
A) A positive change in the technology used to produce apples and decrease in the price of oranges, a substitute for apples.
B) An increase in the wages of apple workers and an increase in the price of oranges, a substitute for apples.
C) An increase in the number of apple producers and a decrease in the number of apple trees as a result of disease.
D) A decrease in the wages of apple workers and an increase in the price of oranges, a substitute for apples.
Correct Answer:
Verified
Q203: "Because apples and oranges are substitutes, an
Q215: The cost of raising beef cattle has
Q216: Select the phrase that correctly completes the
Q216: The following appeared in a Florida newspaper
Q218: All else equal, the decrease in the
Q222: If the demand for a product increases
Q225: Studies have shown that drinking one glass
Q225: Article Summary
More than a million Americans are
Q229: If the demand curve for a product
Q238: Suppose favorable weather resulted in a bumper
Unlock this Answer For Free Now!
View this answer and more for free by performing one of the following actions

Scan the QR code to install the App and get 2 free unlocks

Unlock quizzes for free by uploading documents