
Figure 4-4
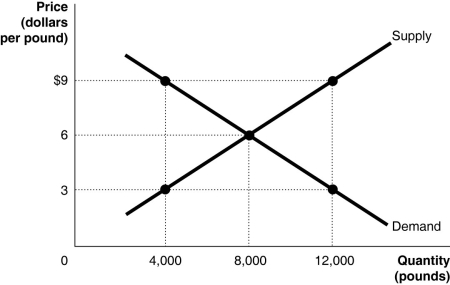
-Refer to Figure 4-4.The figure above represents the market for pecans.Assume that this is a competitive market.If the price of pecans is $9,
A) economic surplus is maximized.
B) too many consumers want to buy pecans.
C) the quantity supplied is greater than the economically efficient quantity.
D) the quantity demanded is economically efficient but the quantity supplied is economically inefficient.
Correct Answer:
Verified
Q88: Figure 4-4 Q89: Economic efficiency is a market outcome in Q90: If equilibrium is achieved in a competitive Q91: Deadweight loss refers to the reduction in Q92: If marginal benefit is greater than marginal Q94: Figure 4-4 Q95: In a competitive market, the demand curve Q96: If the market price is at equilibrium, Q97: Figure 4-4 Q98: Figure 4-4 Unlock this Answer For Free Now! View this answer and more for free by performing one of the following actions Scan the QR code to install the App and get 2 free unlocks Unlock quizzes for free by uploading documents
![]()
![]()
![]()
![]()

