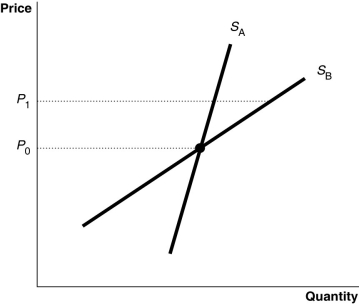
Figure 6-12

-Refer to Figure 6-12.The diagram shows two supply curves, SA and SB.As price rises from P₀ to P₁, which supply curve is more elastic?
A) SA
B) SB
C) They are equally inelastic.
D) They are equally elastic.
Correct Answer:
Verified
Q269: Over longer periods of time, increases in
Q270: Which of the following is a key
Q271: Suppose when the price of jean-jackets increased
Q272: Inelastic supply occurs whenever the elasticity of
Q273: A supply curve that is vertical
A)is perfectly
Q275: If a supply curve is a horizontal
Q276: Suppose the demand curve for a product
Q277: The price elasticity of supply measures
A)the responsiveness
Q278: If an 8 percent decrease in the
Q279: Table 6-8
![]()
Unlock this Answer For Free Now!
View this answer and more for free by performing one of the following actions

Scan the QR code to install the App and get 2 free unlocks

Unlock quizzes for free by uploading documents