Figure 10-6 the Above Panels Show Various Combinations of Indifference Curves and Combinations
Figure 10-6
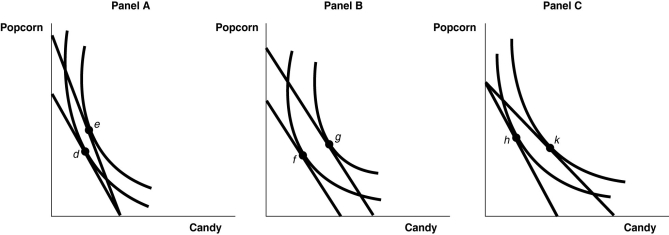
The above panels show various combinations of indifference curves and budget constraints for two products: Popcorn and Candy.
-Refer to Figure 10-6.Which diagram demonstrates an increase in total utility following a decrease in the price of popcorn?
A) the movement from d to e in Panel A
B) the movement from f to g in Panel B
C) the movement from h to k in Panel C
D) none of the above
Correct Answer:
Verified
Q261: A curve that shows combinations of consumption
Q264: Which of the following statements about utility
Q265: Suppose the consumer's income increases while the
Q266: Figure 10-6 Q267: Figure 10-7 Q268: Figure 10-6 Q269: Figure 10-5 Q272: Figure 10-7 Q273: Why do convex indifference curve have a Q274: Figure 10-6 Unlock this Answer For Free Now! View this answer and more for free by performing one of the following actions Scan the QR code to install the App and get 2 free unlocks Unlock quizzes for free by uploading documents
![]()
![]()
![]()
![]()
![]()
![]()

