Solved
Figure 10-6 the Above Panels Show Various Combinations of Indifference Curves and Combinations
Multiple Choice
Figure 10-6
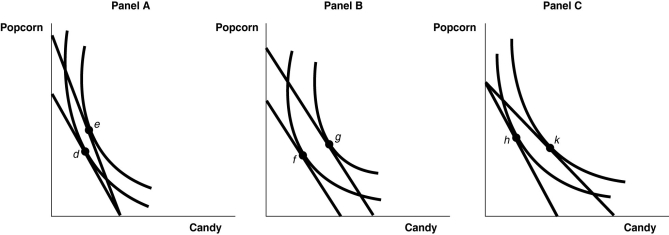
The above panels show various combinations of indifference curves and budget constraints for two products: Popcorn and Candy.
-Refer to Figure 10-6.Which diagram demonstrates a decrease in total utility following an increase in the price of candy?
A) the movement from e to d in Panel A
B) the movement from g to f in Panel B
C) the movement from k to h in Panel C
D) none of the above
Correct Answer:
Verified
Related Questions

