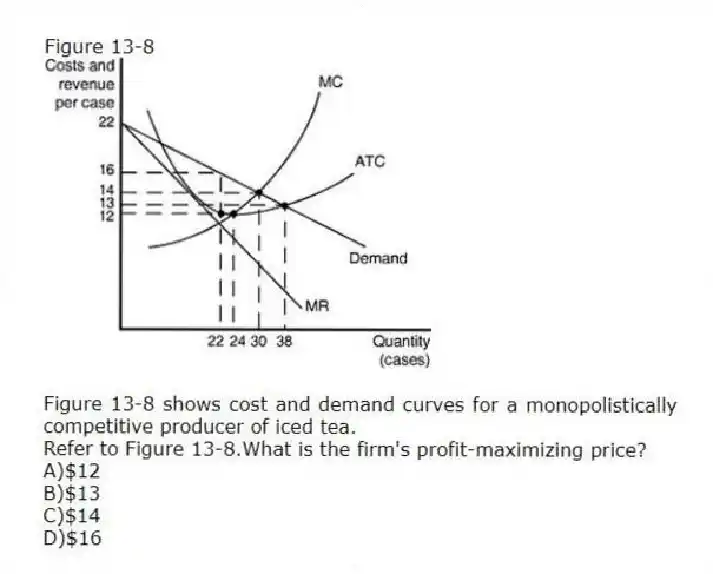
Figure 13-8
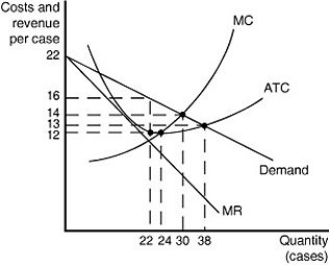
Figure 13-8 shows cost and demand curves for a monopolistically competitive producer of iced tea.
-Refer to Figure 13-8.What is the firm's profit-maximizing price?
A) $12
B) $13
C) $14
D) $16
Correct Answer:
Verified
Q105: Unlike a perfectly competitive firm, a monopolistic
Q106: For a monopolistically competitive firm, price equals
Q107: Figure 13-9 Q108: Figure 13-10 Q109: Figure 13-8 Q111: Figure 13-9 Q112: Consumers in a monopolistically competitive market do Q113: A profit-maximizing monopolistically competitive firm produces and Q114: Figure 13-6 Q115: Central Grocery in New Orleans is famous Unlock this Answer For Free Now! View this answer and more for free by performing one of the following actions Scan the QR code to install the App and get 2 free unlocks Unlock quizzes for free by uploading documents
![]()
![]()
![]()
![]()
![]()

