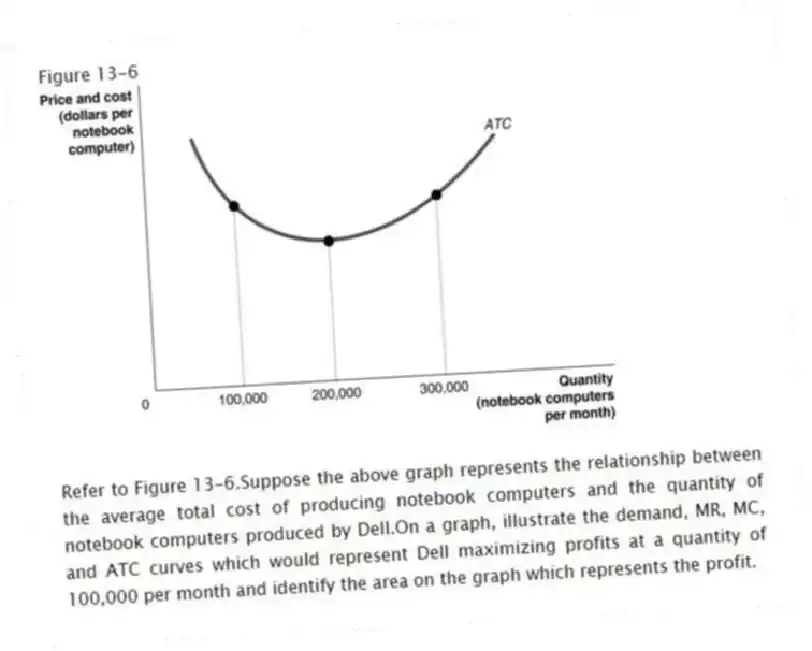
Figure 13-6
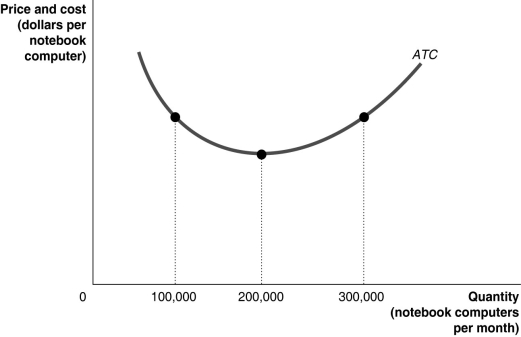
-Refer to Figure 13-6.Suppose the above graph represents the relationship between the average total cost of producing notebook computers and the quantity of notebook computers produced by Dell.On a graph, illustrate the demand, MR, MC, and ATC curves which would represent Dell maximizing profits at a quantity of 100,000 per month and identify the area on the graph which represents the profit.
Correct Answer:
Verified
Q109: Figure 13-8 Q110: Figure 13-8 Q111: Figure 13-9 Q112: Consumers in a monopolistically competitive market do Q113: A profit-maximizing monopolistically competitive firm produces and Q115: Central Grocery in New Orleans is famous Q116: Arturo runs a Taco Bell franchise.He is Q117: Figure 13-8 Q118: Figure 13-8 Q119: A monopolistically competitive industry that earns economic Unlock this Answer For Free Now! View this answer and more for free by performing one of the following actions Scan the QR code to install the App and get 2 free unlocks Unlock quizzes for free by uploading documents
![]()
![]()
![]()
![]()
![]()

