Figure 18-3
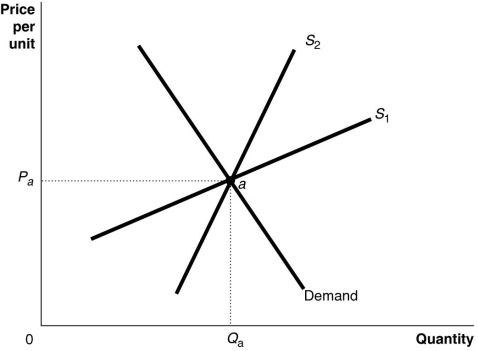
-Refer to Figure 18-3.The figure above shows a demand curve and two supply curves, one more elastic than the other.Use Figure 18-3 to answer the following questions.
a.Suppose the government imposes an excise tax of $1.00 on every unit sold.Use the graph to illustrate the impact of this tax.
b.If the government imposes an excise tax of $1.00 on every unit sold, will the consumer pay more of the tax if the supply curve is S₁ or S₂? Refer to the graphs in your answer.
c.If an excise tax of $1.00 on every unit sold is imposed, will the revenue collected by the government be greater if the supply curve is S₁ or S₂?
d.If the government imposes an excise tax of $1.00 on every unit sold, will the deadweight loss be greater if the supply curve is S₁ or S₂?
Correct Answer:
Verified
View Answer
Unlock this answer now
Get Access to more Verified Answers free of charge
Q203: Figure 18-5 Q204: Figure 18-6 Q206: Figure 18-4 Q207: Figure 18-6 Q211: As the value of the Gini coefficient Q213: Article Summary Q216: A statistical tool used to measure inequality Q216: Suppose the equilibrium price and quantity of Q217: Figure 18-4 Q219: Figure 18-5 Unlock this Answer For Free Now! View this answer and more for free by performing one of the following actions Scan the QR code to install the App and get 2 free unlocks Unlock quizzes for free by uploading documents
![]()
![]()
![]()
![]()
Monthly marijuana sales in Colorado topped
![]()
![]()

