Figure 10-2
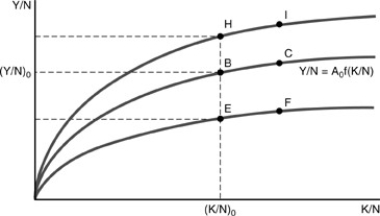
-Initially,the economy is at point B on Figure 10-2 above.According to the Solow growth model,a dramatic decrease in the rate of saving after complete adjustment shifts the economy from ________.
A) B to H,increasing output per capita
B) B to C,increasing output and capital per capita
C) B to D,decreasing the output and capital per capita in the long run
D) B to E,decreasing output per capita but holding per capita capital constant
Correct Answer:
Verified
Q51: If technological change is "neutral," then
A)output per
Q52: Figure 10-1 Q53: The "nonconvergence" problem with the Solow growth Q54: Extensive growth is driven by Q55: One of the shortcomings of the Solow Q57: In the graph of the Solow growth Q58: In the Solow growth model,from an initial Q59: Figure 10-1 Q60: Change in "total factor productivity" may be Q61: Figure 10-5 Unlock this Answer For Free Now! View this answer and more for free by performing one of the following actions Scan the QR code to install the App and get 2 free unlocks Unlock quizzes for free by uploading documents
![]()
A)very high savings
![]()
![]()

