Figure 10-5
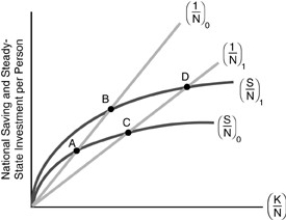
-In Figure 10-5 above,suppose that the economy's initial steady-state point is A.An increase in the rate of national saving changes the steady-state point to
A) point B.
B) point C.
C) point D.
D) a point to the left of point A.
Correct Answer:
Verified
Q61: Figure 10-5 Q62: Figure 10-3 Q63: Figure 10-5 Q64: The most plausible way to produce a Q65: If K = 3000,n = 0.02,and d Q67: Suppose that we interpret N as the Q68: Figure 10-5 Q69: In graphing the Solow growth model,the per-person Q70: Suppose s = 0.18,Y = 4000,K = Q71: Figure 10-5 Unlock this Answer For Free Now! View this answer and more for free by performing one of the following actions Scan the QR code to install the App and get 2 free unlocks Unlock quizzes for free by uploading documents
![]()
![]()
![]()
![]()
![]()

