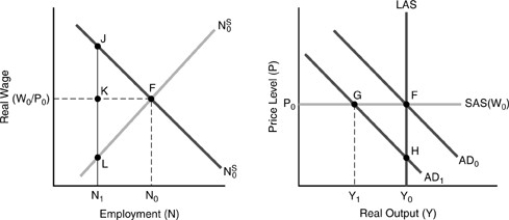
In Figure 17-4,below,initial demand,marginal cost,and marginal revenue curves (none of them shown) caused the firm to produce the profit-maximizing quantity Y₀ at a price of P₀.Now the demand and marginal cost curves have moved to those shown,with the marginal revenue curve running through point L.
Figure 17-4
-If the firm in Figure 17-4 above maintains its set price of P₀,its profit is
A) G + H.
B) G + J.
C) F + G + J.
D) G + H + J + K.
E) J + K.
Correct Answer:
Verified
Q149: Initially a firm pays a wage and
Q150: According to efficiency wage theory,a firm that
Q151: About what percentage of the U.S.labor force
Q152: Because efficiency wage theory deals with the
Q153: Were the government to decree that henceforth
Q155: In Figure 17-4,below,initial demand,marginal cost,and marginal revenue
Q156: Suppose a worker signs a contract containing
Q157: Efficiency wage theory provides a reason for
Q158: If all firms are paying efficiency wages
Q159: In Figure 17-4,below,initial demand,marginal cost,and marginal revenue
Unlock this Answer For Free Now!
View this answer and more for free by performing one of the following actions

Scan the QR code to install the App and get 2 free unlocks

Unlock quizzes for free by uploading documents