Figure 2-1
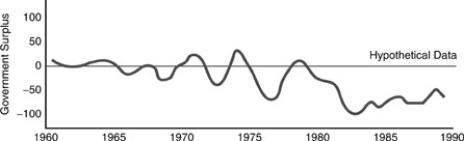
-Assuming a closed economy (i.e. ,NX =O) the data in Figure 2-1 suggest that for each year after 1980
A) private saving could have been either positive or negative.
B) private saving was negative.
C) private saving was positive.
D) private saving equaled zero.
Correct Answer:
Verified
Q33: Adding up all transactions in the economy
Q34: By definition,when the economy is in equilibrium
Q35: Suppose that steel produced this year is
Q36: Which of the following is NOT an
Q37: An intermediate good is
A)always counted when measuring
Q39: A farmer sells raw milk for 50
Q40: The difference between gross investment and net
Unlock this Answer For Free Now!
View this answer and more for free by performing one of the following actions

Scan the QR code to install the App and get 2 free unlocks

Unlock quizzes for free by uploading documents