Multiple Choice
Table 2-2
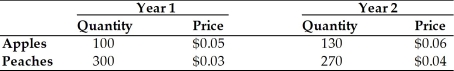
-Refer to above Table 2-2.What is the increase in real GDP between years 1 and 2 at fixed year 2 prices?
A) 2.1%
B) 5.1%
C) 4.4%
D) 3.3%
Correct Answer:
Verified
Related Questions
Table 2-2
-Refer to above Table 2-2.What is the increase in real GDP between years 1 and 2 at fixed year 2 prices?
A) 2.1%
B) 5.1%
C) 4.4%
D) 3.3%
Correct Answer:
Verified

