Multiple Choice
Table 2-2
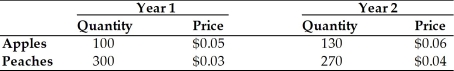
-Refer to above Table 2-2.The geometric average of the increase in real GDP between year 1 and year 2 is
A) 3.1%.
B) 3.2%.
C) 3.3%.
D) 3.8%.
Correct Answer:
Verified
Related Questions
Q94: The measured unemployment rate will be understated
Q95: Indicate which of the following individuals would
Q96: Table 2-2 Q97: Official unemployment statistics in the United States Q98: Claire works fifteen hours a week at
![]()
Unlock this Answer For Free Now!
View this answer and more for free by performing one of the following actions

Scan the QR code to install the App and get 2 free unlocks

Unlock quizzes for free by uploading documents