Multiple Choice
Figure 3-5
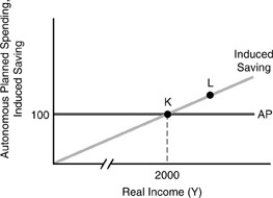
-In Figure 3-5 above,the saving function is
A) 100 + 0.8(Y -T) .
B) -100 + 0.05(Y -T) .
C) 0.2Y - 100.
D) 100 + Y - T.
Correct Answer:
Verified
Related Questions
Q54: In our consumption function,when disposable income is
Q55: When stock prices fall significantly,people may feel
Q56: If Y = $200 billion,c = 0.75,autonomous
Q57: Assume that the marginal propensity to consume
Q58: The slope of the planned expenditure line
Q60: Total income is always equal to _
Q61: In 2005 real personal saving has decreased
Unlock this Answer For Free Now!
View this answer and more for free by performing one of the following actions

Scan the QR code to install the App and get 2 free unlocks

Unlock quizzes for free by uploading documents