Multiple Choice
Figure 3-7
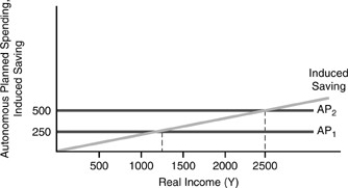
-In Figure 3-7 above,the marginal propensity to save is
A) 1.
B) 5.
C) 0.5.
D) 0.2.
Correct Answer:
Verified
Related Questions
Q73: In equilibrium,
A)income = planned expenditures.
B)unplanned inventory investment
Q74: If Ep is 2500 and Y is
Q75: If Ep is 2500 and Y is
Q76: Figure 3-6 Q77: Total planned expenditures are Q79: Figure 3-6 Q80: One way to view equilibrium in the Q81: Income on the horizontal axis at which Q82: Figure 3-4 Q83: On a diagram of the planned expenditure Unlock this Answer For Free Now! View this answer and more for free by performing one of the following actions Scan the QR code to install the App and get 2 free unlocks Unlock quizzes for free by uploading documents
![]()
A)C + Ip.
B)Ep +
![]()
![]()

