Multiple Choice
Figure 3-4
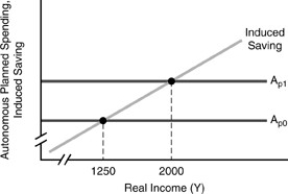
-In Figure 3-4 above,an equilibrium income of 2000 occurs when planned autonomous spending is
A) 750.
B) 800.
C) 1250.
D) 250.
Correct Answer:
Verified
Related Questions
Q87: Figure 3-4 Q88: Income on the horizontal axis at which Q89: Figure 3-7 Q90: Figure 3-4 Q91: If Ap is total autonomous planned spending,c Q93: Income on the horizontal axis at which Q94: Figure 3-7 Q95: Figure 3-4 Q96: Income on the horizontal axis at which Q97: Figure 3-3 Unlock this Answer For Free Now! View this answer and more for free by performing one of the following actions Scan the QR code to install the App and get 2 free unlocks Unlock quizzes for free by uploading documents
![]()
![]()
![]()
![]()
![]()
![]()

