Figure 3-7
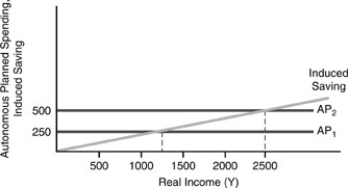
-In Figure 3-7 above,the multiplier effect does NOT explain
A) the increase in equilibrium income.
B) the increase in induced saving.
C) the increase in AP.
D) all of the above.
Correct Answer:
Verified
Q108: Which of the components of total planned
Q109: In the consumption function C = a
Q110: If the MPS is 0.1 and the
Q111: Since income tax revenues will rise (fall)as
Q112: A $1 increase in autonomous spending has
Q114: Which of the following defines the multiplier
Q115: If the MPS is 0.1 and the
Q116: Should autonomous consumption fall by one dollar,the
Q117: Figure 3-7 Q118: A marginal propensity to save of 0.20
![]()
Unlock this Answer For Free Now!
View this answer and more for free by performing one of the following actions

Scan the QR code to install the App and get 2 free unlocks

Unlock quizzes for free by uploading documents