Multiple Choice
Figure 6-3
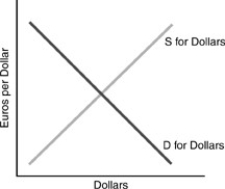
-In Figure 6-3 above,the supply curve is generated by
A) U.S.exports.
B) European imports.
C) U.S.imports.
D) foreign investors' desire to purchase U.S.factories.
Correct Answer:
Verified
Related Questions
Q114: Between 2002 and 2010,foreign official holdings of
Q115: U.S.maintained a large current account deficit in
Q116: Figure 6-1 Q117: From 1996 till 2001,dollar was _,causing net Q118: Long-term trends in the exchange rate are
![]()
Unlock this Answer For Free Now!
View this answer and more for free by performing one of the following actions

Scan the QR code to install the App and get 2 free unlocks

Unlock quizzes for free by uploading documents