Figure 8-6
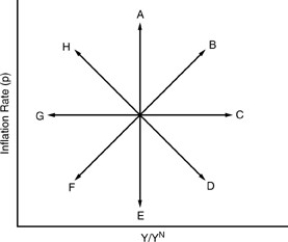
-In Figure 8-6 above,the one year since 1970 that the U.S.economy managed to travel along path E was
A) 1971.
B) 1970.
C) 1979.
D) 1986.
Correct Answer:
Verified
Q15: Supply inflation is triggered by changes in
A)the
Q16: The European Monetary System
A)led to resurgent inflation
Q17: Supply shocks in the 1990s
A)reduced the natural
Q18: Low inflation rate in the late 1990
Q19: Continuous inflation requires repeated _ shifts of
Q21: When the actual inflation rate is equal
Q22: In _ there were beneficial supply shocks
Q23: A positive relationship between inflation and unemployment
Q24: The short-run SAS curve is positively sloped
Q25: Suppose that the government enforced a law
Unlock this Answer For Free Now!
View this answer and more for free by performing one of the following actions

Scan the QR code to install the App and get 2 free unlocks

Unlock quizzes for free by uploading documents