Figure 8-5
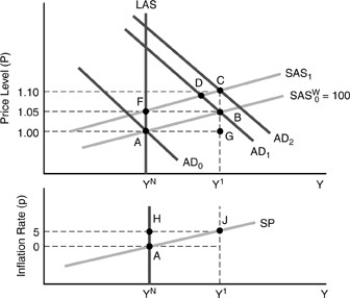
-In Figure 8-5 above,in going from points A to B the real wage ________,and then from point B to point C (where the exact price level is 1.1025,rounded to 1.10 in the diagram) the real wage ________.
A) rose,remained constant
B) rose,rose again
C) fell,remained constant
D) fell,fell again
E) remained constant,remained constant
Correct Answer:
Verified
Q37: The flatter the SP curve
A)the greater will
Q38: A policy to slow the growth of
Q39: The slope of the SP curve is
Q40: A negative relationship between inflation and unemployment
Q41: Figure 8-5 Q43: If there is a permanent adverse supply Q44: Figure 8-5 Q45: Stagflation may be explained by Q46: Figure 8-5 Q47: Everywhere to the right of the long-run Unlock this Answer For Free Now! View this answer and more for free by performing one of the following actions Scan the QR code to install the App and get 2 free unlocks Unlock quizzes for free by uploading documents
![]()
![]()
A)an upward shift
![]()

