Multiple Choice
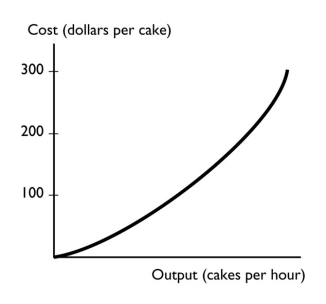
-The graph shows a
A) positive relationship that becomes steeper.
B) negative relationship that becomes steeper.
C) positive relationship that becomes less steep.
D) negative relationship that become less steep.
E) negative trend between the total cost of a cake and the output of cakes.
Correct Answer:
Verified
Related Questions

