Essay
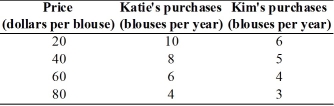
-The table above shows how many blouses Katie and Kim will purchase at different prices for a blouse.In the figure, label the axes and put the price on the y-axis and the quantity of blouses on the x-axis.Plot the data for Katie in the figure.Then, plot the data for Kim in the figure.
Correct Answer:
Verified
View Answer
Unlock this answer now
Get Access to more Verified Answers free of charge
Related Questions

