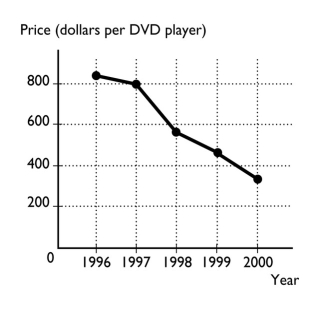
-The figure above shows the price of a DVD player from 1996 to 2000.
a.What type of graph is illustrated above?
b.What is the trend in the price of a DVD player?
Correct Answer:
Verified
View Answer
Unlock this answer now
Get Access to more Verified Answers free of charge
Q236: Explain whether the statement, "There is life
Q237: What is the difference between positive and
Q316: Rather than go out to eat by
Q317: Why does scarcity lead to the what,how,and
Q319: In New State,the bottling law requires that
Q320: Shaniq can spend the next hour studying
Q322: In the diagram below,label the x-axis,the y-axis,and
Unlock this Answer For Free Now!
View this answer and more for free by performing one of the following actions

Scan the QR code to install the App and get 2 free unlocks

Unlock quizzes for free by uploading documents